Results
Use the results tabs to understand your calibration and decide what to improve. Start with image errors and coverage, then use the other views to investigate specific concerns.
Results describe the latest calibration run. If you change which observations are included, run optimization again to update them.
Reprojection error
Reprojection error is the distance between a detected feature and the position predicted by the calibration, in pixels. RMS summarizes these errors, giving larger errors more weight than the mean or median.
The usual reprojection error measures agreement with the images used for calibration. Test RPE measures held-out observations. Neither converts directly into millimetre accuracy for every application.
See Analysis for a step-by-step review.
Scene Display
Inspect the cameras, targets, and other devices in 3D. Use the context menu to show all poses or focus on a selected pose.
Axes are red for X, green for Y, and blue for Z. Camera bodies and axis lengths are visual aids, not physical measurements.
Convergence
The curve shows how the optimization progressed. Hover over points for individual values.
Check the reported outcome: convergence, a time or iteration limit, cancellation, and failure mean different things. A flat curve alone does not show that the calibration is correct.
Initialization
This view shows the starting estimate before optimization. Use Parameters for the final result.
Parameters
Inspect the final camera parameters and whether they were free or fixed. Standard deviations are shown when uncertainty estimation is available.
Large uncertainty can indicate that the dataset does not constrain a parameter well. A fixed parameter was not estimated, so zero reported uncertainty does not mean its supplied value is physically exact.
Use Export Parameters to use the result outside Calib GEOM.
Distortion
Shows how much the lens-distortion mapping moves image content. This is lens distortion, not reprojection error.
Use Vector scale to make the arrows easier to see. Hover for displacement in pixels. Gray regions indicate unavailable or unsupported samples.
Strong distortion is not necessarily a problem; what matters is whether the calibration describes it reliably.
Coverage
Shows how often the detected target covered each part of the image. Look for poorly observed edges and corners and strongly uneven coverage.
Coverage counts target footprints, not individual features. Inspect the detections as well: a large target outline may cover areas containing few actual points. Good coverage also needs varied tilts and distances.
Map availability
Maps may take time to appear, especially for large images or multi-camera setups. If a calculation was cancelled, use the offered generation control. If Retry Display appears, use it to try displaying the map again. Calib GEOM reports when a map is too large for the available resources.
RPE Bars
Compare per-image RMS errors across cameras and poses. Hover for a value; click a bar to inspect its image.
Drag the rejection threshold to change which images are included, then run optimization again. Investigate high errors before excluding images. See Refining the calibration.
RPE Scatter/Density
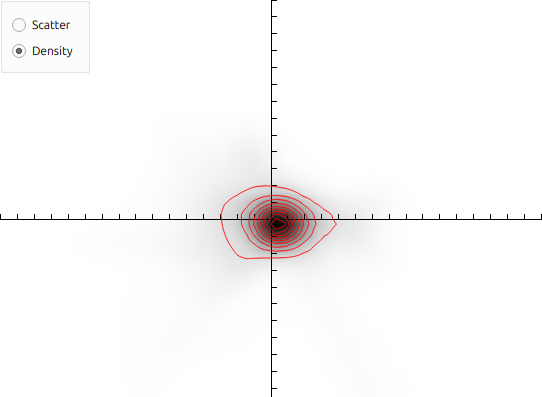
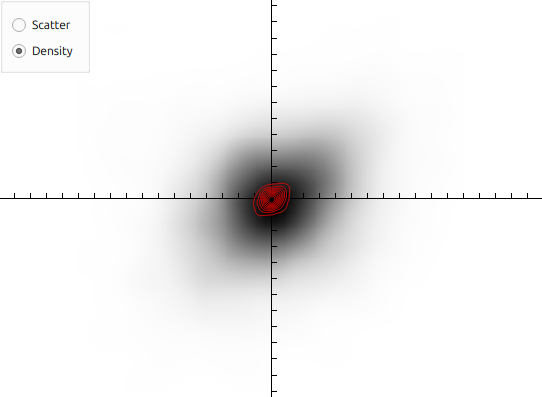
Scatter shows the horizontal and vertical errors for individual features, centred around zero. It does not show where those features were in the image. Click a point to locate its observation.
Density makes the shape of the error distribution easier to see. Its contours show levels relative to the peak density, not percentages of points enclosed.
A compact, centred distribution is encouraging. Elongation, separate clusters, or an uneven shape are reasons to inspect images and residual maps.
RPE Magnitudes and Directions
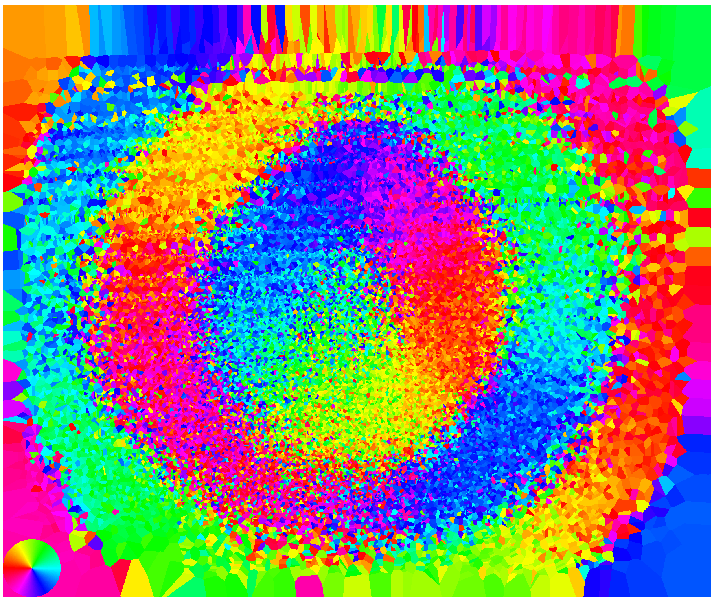
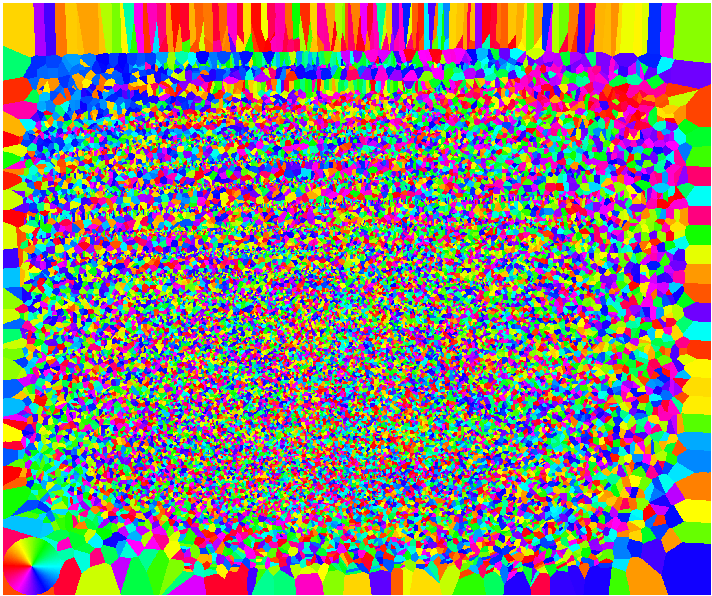
Magnitudes shows where feature errors are larger. Directions shows which way the errors point. Smooth, repeated patterns can reveal systematic problems that a single RMS value hides.
Each coloured region represents a nearby detected feature; it is not a measurement at every pixel. Large regions can simply mean sparse sampling. Gray areas have no available value.
The magnitude colour scale adapts to each camera. Use numerical values, not colour alone, when comparing cameras or calibrations. The circular colour key in the direction map is a legend, not data.
RPE Features
Shows errors on the target's feature layout. Use it to find features that repeatedly have high errors, then inspect their source images for damage, reflections, occlusion, or detection problems.
Hover for feature statistics and click to select a feature. Error scale changes only the display.
Correlations
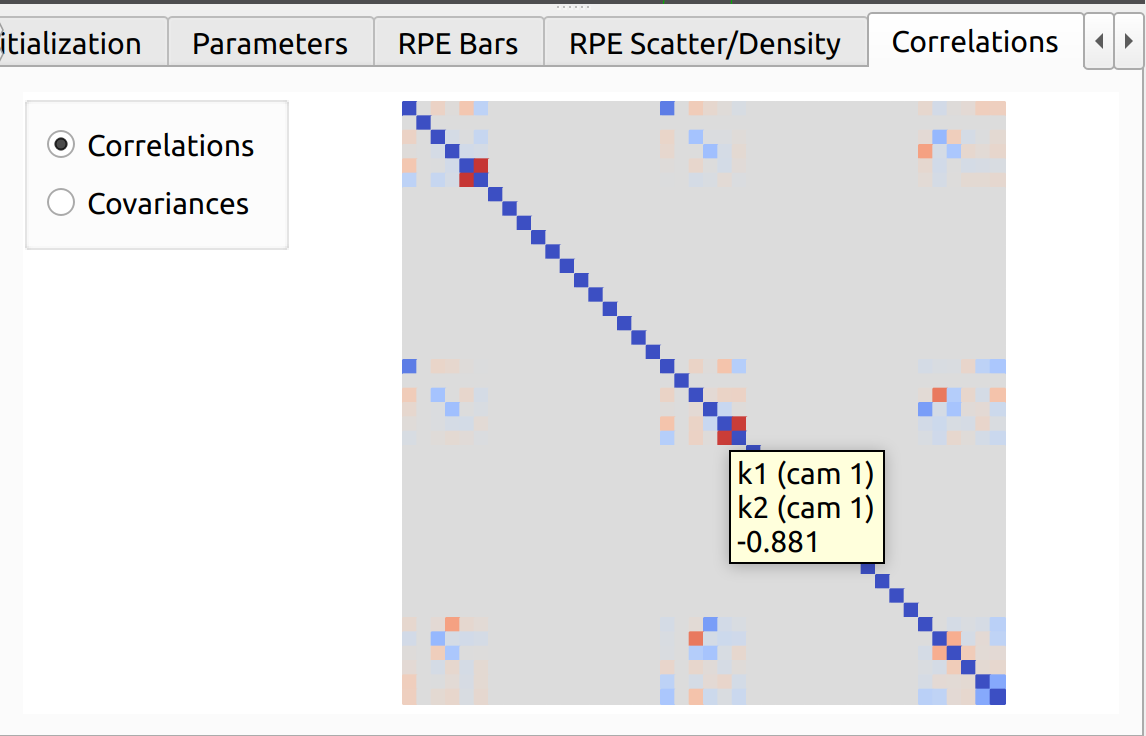
Available when covariance estimation succeeds. This view shows how strongly estimated parameters vary together.
Strong correlation may suggest that more informative images or a simpler model would help. It is not automatically a fault: some useful model parameters naturally compensate for one another.
Interpret correlations together with uncertainty, residuals, and Test RPE, rather than rejecting a model because of one matrix entry.
Projection Error
Enable Estimate projection error before optimization. The ellipses show estimated image-plane uncertainty from the calibration parameters.
Hover for numerical values. Ellipse scale changes the display size only. The nominal 95% ellipses depend on the uncertainty model; they are not measured test errors or a guarantee about future images.
Triangulation Error
For multi-camera calibrations, enable Estimate triangulation error before optimization to inspect estimated 3D uncertainty.
- Set Feature noise to a realistic image-feature uncertainty in pixels.
- Set Plane offset to a working distance relevant to your application.
- Use Ellipse scale to adjust the displayed size of the uncertainty shapes.
Hover for numerical values. This helps compare measurement regions and camera geometry, but does not include every source of real-world measurement error.
Target Geometry
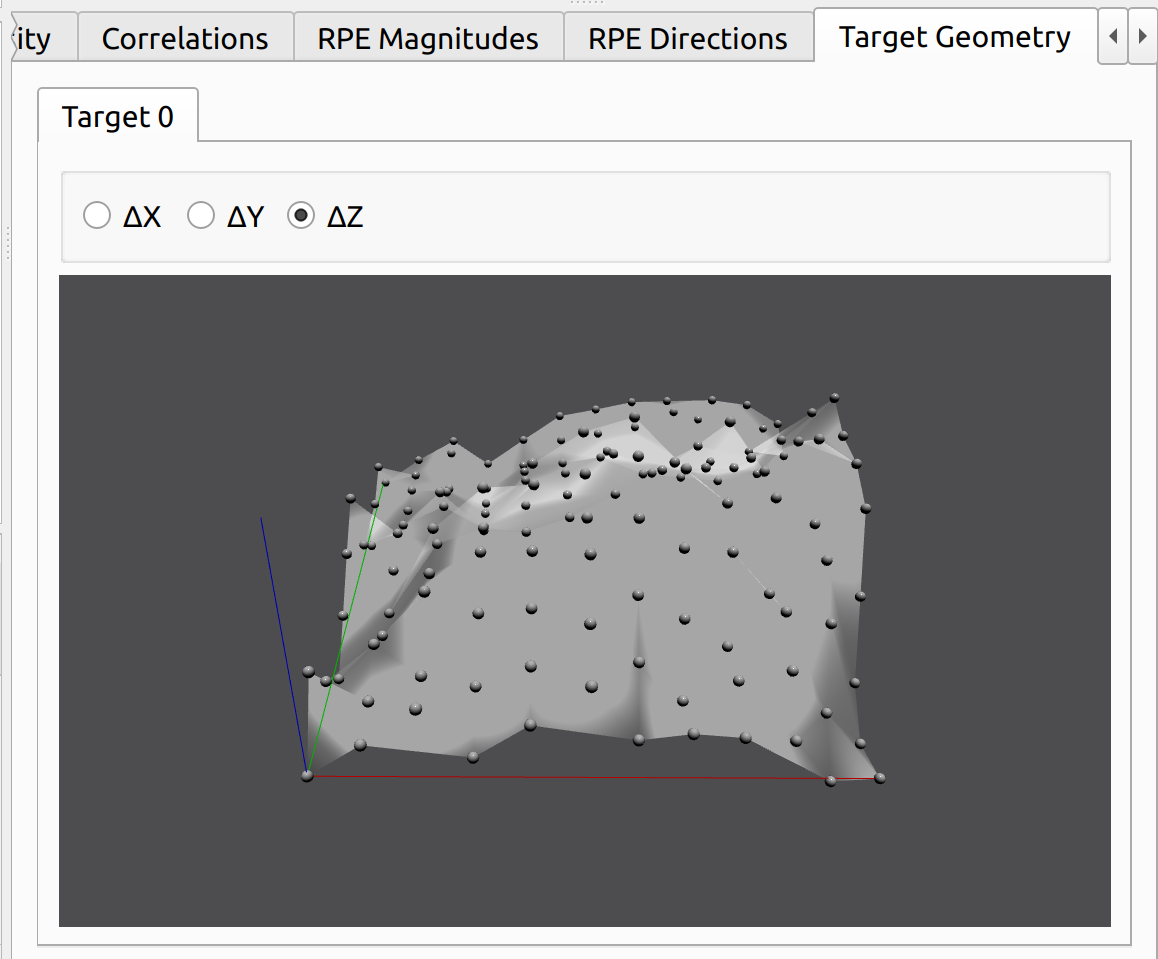
Shows differences between fitted and nominal target points when target geometry has been optimized. Select Delta X, Delta Y, or Delta Z, and hover for values.
Deviations are exaggerated for visibility. This is a fitted result, not an independent physical measurement of the target.
Statistics
Both editions show pooled and per-camera RMS, mean, and median error summaries.
Detailed statistics and export
Pro feature
Statistical tests, per-target/pose/feature summaries, and statistics text export require Calib GEOM Pro.
The text report summarizes errors by camera, pose, and feature and includes statistical checks for unusual residual behaviour.
| Statistic | How to use it |
|---|---|
| RMS, mean, median | Compare overall error and the influence of outliers. |
| Henze-Zirkler (HZ) | Checks whether the horizontal and vertical residuals resemble a normal distribution. |
| Distance correlation (dCor) | Looks for a relationship between residuals and image or target position. |
| p-value | Indicates evidence against the assumption being tested; it is not the probability that a calibration is wrong. |
Use these checks to guide investigation, not as automatic pass/fail rules. Large datasets can make small departures statistically significant. Inspect the size and pattern of the errors and their relevance to your task. In multi-target datasets, the text's feature-ID summaries can combine equal feature IDs from different targets; use RPE Features to inspect a particular target.
Use the tab's export control to save the statistics.
Navigation and exporting views
In 2D views, use the wheel to zoom, right-drag to pan, and double-click to reset. In 3D, left-drag rotates, right- or middle-drag pans, and the wheel changes distance. Supported trackpads also offer pan and pinch gestures.
Where available, right-click for Reset view or Export as .png. For a complete record, export a calibration report and retain the source data. In Pro, also keep the project.